PRTG Manual: General Layout
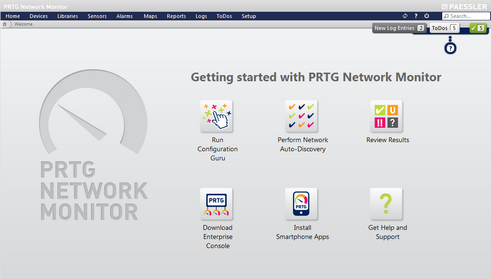
Once you've run through the Configuration Guru you will see PRTG's welcome page as default after you log in to the web interface. This page helps you to re-run the configuration guru, add sensors manually, perform an automatic network search, review results, download the Enterprise Console or smart phone applications, and get further help and support.

Welcome Screen
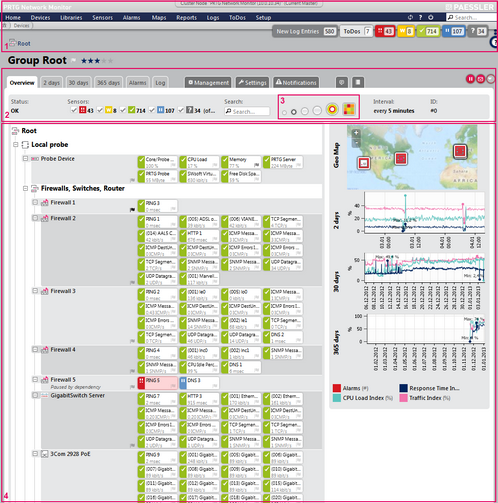
Click on the Review Results option to display the tree-like device view which will be a starting point for everyday use.

PRTG Device Tree
From top to bottom, the main layout consists of:
Screen Number |
Part |
Description |
1 |
This element contains the main menu at the top, the global status bar, and a quick search box. |
|
2 |
This element contains the page heading with the name of the current object, the tabs bar which leads to the content of the current object, and the object's status bar. |
|
3 |
This selection is part of the page header bar. Using the provided options you can define how your device tree is displayed. |
|
4 |
This element contains information about the current object and all other objects underneath in the tree hierarchy. |
Simply click on an object to see more details about it. In the page heading of the page header bar you always see which object you're looking at.
When you navigate through PRTG's web interface you will always use one of the following navigational paths:
- The main menu provides access to all important aspects of the software.
- The quick search is often the fastest way to navigate to an object.
- Using the page's tabs, you can switch between various sub-pages for an object.
- Many objects offer a context menu that will pop up when you right-click them.
- Many objects offer a quick-info menu that will pop up when hovering an object
- And, finally, you are able to drill down into the object hierarchy of probes, groups, devices, and sensors in the object tree by merely clicking an sub-object of the currently displayed object (for example, a sensor on the device page).
These six navigation paths put PRTG's complete functionality at your fingertips. Quite likely you are already familiar with these techniques from many other websites and web-based user interfaces.
In the following, the different areas of the web interface are described.

PRTG's Cluster Info, Main Menu, Breadcumbs, and Global Status Bar
The header area of the web interface is both base for the most important information of your installation and starting point for all actions. You can view the global status and navigate through the web interface using the main menu.
Note: This documentation refers to the PRTG System Administrator user accessing the Ajax interface on a master node. For other user accounts, interfaces, or nodes, not all of the options might be available as described. When using a cluster installation, failover nodes are read-only by default.
The global header area consists of the following parts:
Screen Number |
Part |
Description |
1 |
Gray Cluster Information Bar |
This element is only visible when running PRTG in a cluster. It shows the name of the node you are logged in and displays whether this is a master or a failover node. Click the bar to show the Cluster Status. In a failover node, you can review all data, but changes in the settings will not be saved. In order to change settings, please log into the master node of your cluster. |
2 |
Blue Main Menu Bar |
Navigating through the web interface is performed using the main menu. Please take a few minutes to familiarize yourself with all menu items and sub-items. A detailed description can be found in the Main Menu Structure section. |
3 |
Icons Refresh, Help Center, Logout |
With the icons on the right you can reload the current page, open the help center or log the current user out. |
4 |
'Breadcrumbs' |
Below the main menu, there is always a path shown, leading to the homepage. Use it to go back to where you came from. It can also help you to orient yourself in case you get lost. If you click on a 'breadcrumb' item to open a drop-down menu showing all available object on the same level. Enter a view letters to search for a name, or select an object directly. For example, you can use this to directly access all other sensors or a device, the other devices within a group, another group on the same probe, or other probes in your root group. |
5 |
White Search Box |
To search for any monitoring object, simply enter the name, part of the name, an IP address, a DNS name or a tag in the search box on the right and hit the enter key. A web page with all items that fit the search term will be returned—even displaying online help articles. |
6 |
Blue Help Box ("Roller Blind") |
A context sensitive help text for every page is displayed in the blue roller blind on the right. There is a ribbon hanging down: Click on the x symbol to roll up the blind and on the question mark ? symbol to pull it down. |
7 |
Buttons New Alarms, New Log Entries, ToDo(s) |
These buttons show the number of new alarms or new log entries since last user login as well as the number of ToDo(s) that wait to be acknowledged (only if there are any; in the example screenshot there are only new ToDo(s)). Click on the respective button to view the Alarms, Logs, or ToDos. |
8 |
Global Sensor State Symbols |
This area shows the aggregated status of all sensors you have configured for monitoring, divided into different sensor states. Depending on the sensors' status you will see colored boxes with numbers which symbolize the sensors. For example, you can see how many sensors are in Up, Down, or Warning state. Click on a box to view a list of all sensors in the respective status. For a detailed description, please see Sensor States section. |
In the page header under the global header area, you see the name of the current object and the page content underneath. When displaying a group, aggregated sensor states are shown in a sensor bar and there is an option to change the tree view. Furthermore, various information about the current object is reported here.
Note: This documentation refers to the PRTG System Administrator user accessing the Ajax interface on a master node. For other user accounts, interfaces, or nodes, not all of the options might be available as described. When using a cluster installation, failover nodes are read-only by default.

PRTG Page Header Bar with Heading, Tabs, Group Status Icons, and Device Tree View Selection
The page header and tabs area consists of the following parts:
Screen Number |
Part |
Description |
1 |
Page Heading |
This line displays the kind of the current object and the name as page heading. In the screenshot above, it is a group which is called Firewalls, Switches, Router. Here you also can add the current object to favorites by clicking on the flag, as well as you can define the object's priority by clicking on one of the five stars. For details, please see section Priority and Favorites. |
2 |
Object Path |
For groups, devices, and sensors the path in the device tree to the current object is shown (in the screenshot the path is Local Probe » Firewall, Switches, Router). If the current object is the root group, Root will be displayed. |
3 |
Tabs |
Using the tabs you can navigate to various sub-pages of an object, showing monitoring data or changing settings. For more information, please see sections Review Sensor Data and Change Device and Sensor Settings. |
4 |
Context Buttons |
On the right side there are icons to pause or delete this object, or to add another object. By clicking on the arrow, you can open the context menu for the currently displayed object with even more options. For more information, please see Context Menus section. |
5 |
Object Status |
This element indicates the current status of the selected object. |
6 |
Sensor Status Bar |
This element is visible when viewing a probe, a group (including Root), or a device. It is not available when viewing a sensor's details. The sensor status bar shows the aggregated status of all sensors for the current object, divided into different sensor states. They show the number of sensors in the respective state. For example, you can see how many sensors are in Up, Down, or Warning state. For a detailed description of sensor states, please see Sensor States section. You can hide sensors that are in a certain state by removing the check mark symbol in front of the respective sensor symbol. To show them again, re-add the check mark. |
7 |
Tree Search |
In the white search box next to the tree view selection, enter a key word to search the device tree for matching names. The tree will then highlight matching devices and sensors by graying out all others. This can help to gain a quick overview over sensors monitoring a specific part of your network. For example, you can enter the keyword "firewall" to highlight devices and sensors which match this name. |
8 |
Device Tree View |
This element is only visible when viewing a probe or a group. It is not available when viewing a device's or sensor's details. For a detailed description, see Switch Device Tree View below. |
9 |
Scanning Interval |
This element shows in what time interval PRTG scans the current object. |
10 |
Object ID |
This element shows the ID of the current object. |
When viewing a probe or group, you can choose the way your device tree is shown.

Device Tree View Switch Buttons
Switch Device Tree View—Classic Device Tree
Using the different circle symbols in the page header bar, you can define how much space is used to show devices and sensors in a hierarchical tree structure. In four steps, you can switch from a very condensed view (small circle; marked with 1 in the screenshot) up to an extra large view (big circle; marked with 4 in the screenshot).
In the classic device tree view you can collapse devices, groups, and probes. Click on the minus box left to the object's name. The sensor states will be summarized then. Each status of the sensors on this object will be displayed with the number of sensors currently being in this status—with the exception of the states Down, Down (Partial), and Down (Acknowledged). These will be summarized respectively not before there are more than ten sensors in this status, otherwise they are displayed individually.
Collapsed Device With Summarized Ups and Unusuals and Individual Downs
Switch Device Tree View—Extended Views
There are two additional options to the simple tree views which enable you to display the status of all sensors of your entire installation in a single overview. Click on one of the icons to change the view:
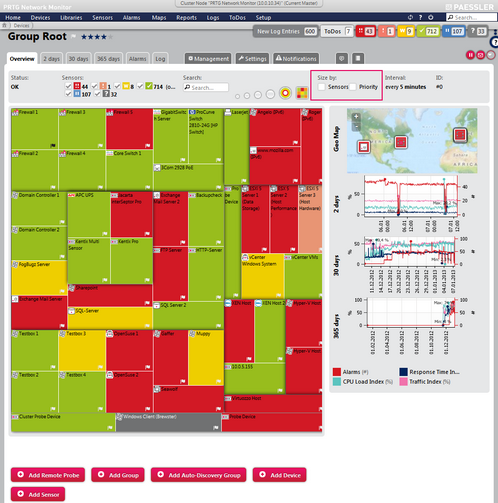
Tree Map View (6)
The tree map view tiles all devices of your entire installation into one square, arranged by the groups you put them into. Each device changes color dynamically to reflect the overall status of the sensors on the device. You can also adjust the size of the squares: either depending on a device's priority, or depending on the number of sensors on a device, or depending on both. For this concern, add a check mark under the point Size by: in front of Sensors and/or Priority in the page header bar (see the mark in the screenshot below).

PRTG Tree Map View
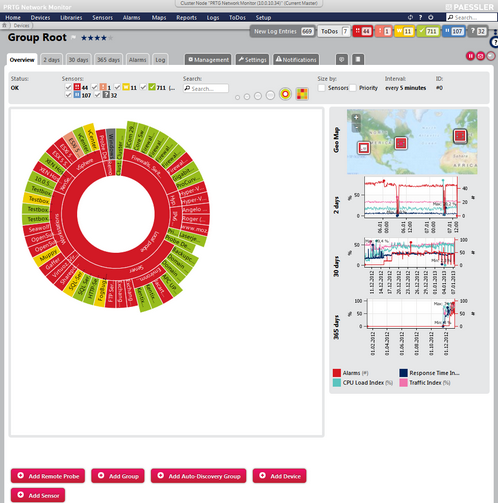
Sunburst View (5)
The sunburst view shows your entire installation in one circle diagram. The groups are represented as inner circles, and all devices contained within a group are shown as 'cake slices' attached to the outside of a circle element.

PRTG Sunburst View
For both views:
- Colors
A device (or group) element can have different colors, depending on the states of the sensors running on this device or group (see Sensor States). A more severe status is regarded more important and wins the color battle. For example, if a device currently has sensors in the states Up (green), Paused (blue), and Warning (yellow), the according device tile in this view would be yellow, indicating that at least one sensor on this device is in Warning status. If there are any red Down sensors, the according device tile will turn red. Following, all possible states in both views are listed ordered by their hierarchy:
Flag |
Flag Color |
Object Status |
Meaning |
|
Red |
Down |
At least one sensor of this object shows a red Down status. Hover an object's name to view the total number of alarms concerning this object. |
|
Bright-Red |
Down (Acknowledged) |
At least one sensor of this object is Down and the status was acknowledged by a PRTG user, applying the Acknowledge Alarm function. The Down states of all sensors of this object have to be acknowledged—if at least one sensor is unacknowledged down, this object will be displayed as Down. |
|
Yellow |
Warning |
At least one sensor of this object shows a yellow Warning status. There is no sensor in a Down or Down (Acknowledged) status concerning this object. |
|
Orange |
Unusual |
At least one sensor of this object shows an orange Unusual status. There is no sensor in a Down, Down (Acknowledged), or Warning status concerning this object. |
|
Green |
Up |
All sensors of this object are in a green Up status. There is no sensor in a Down, Down (Acknowledged), Warning, Paused, or Unusual status concerning this object. |
|
Blue |
Paused |
All sensors of this object show a blue Paused status. There is no sensor in a Down, Down (Acknowledged), Warning, Unusual, or Up status concerning this object. |
|
Black (Grey) |
Unknown |
All sensors of this object have an Unknown status. There is no sensor in a Down, Down (Acknowledged), Warning, Unusual, Paused, or Up status concerning this object. |
- Size by Sensors / Size by Priority
You can adjust the size of the different squares. They can be calculated by the number of sensors running on a device or within a group, or by the sensors' priority (see Priority and Favorites), or both. Use the check boxes in the page header bar (see the mark in the tree map view screenshot) to change view immediately, then use the setting that suits best for your needs.
The page content of the general layout varies dependent on the selected object. It shows information about the current object and all other objects underneath in the tree hierarchy. The deeper down in the hierarchy you select an object, the more detailed is the displayed information.
By default, a Probe Device is created in the device tree on the local probe. It represents the probe system running with your PRTG installation. PRTG automatically monitors the system health of the core server and each probe in order to discover overloading situations that may distort monitoring results. To monitor the system status of the probe computer, PRTG automatically creates a few sensors. These include a Core/Probe Health Sensor, a WMI sensor that measures disk usage, and a bandwidth sensor for all installed network cards. It is recommended to keep these sensors, but you can optionally remove all except the Core/Probe Health sensor. In a cluster installation, PRTG also creates a Cluster Probe Device with a Cluster Probe Health Sensor that monitors the cluster's system health.
You can add (or remove) a device or sensor to favorites by one click on the respective flag displayed with an object (please see the marks in the screenshot below).

One-Click Adding to Favorites in the Device Tree
Another one-click option for adding/removing favorites or setting the priority for a selected device or sensor is given in the page header bar right to the object name (please see screen number 1 in that subsection). Simply click on the flag for favorites or on a star for priority.
One-Click Favorite and Priority in the Page Header Bar
A black flag means that the respective object is a favorite already; clicking on the black flag will remove the object from favorites. A gray flag indicates that it is not a favorite yet. Please see also Priority and Favorites for this concern.
For more details about page contents, please see the following sections:
Knowledge Base: How can I change the width of the devices and group "boxes" shown in the PRTG 9 device tree?
Ajax Web Interface—Basic Procedures—Topics
Other Ajax Web Interface Sections
Related Topics |
|---|
Keywords: General Web Interface Layout,Header,Tree View,Tree View Zoom